What Could Video Gaming Earn for Your Venue?
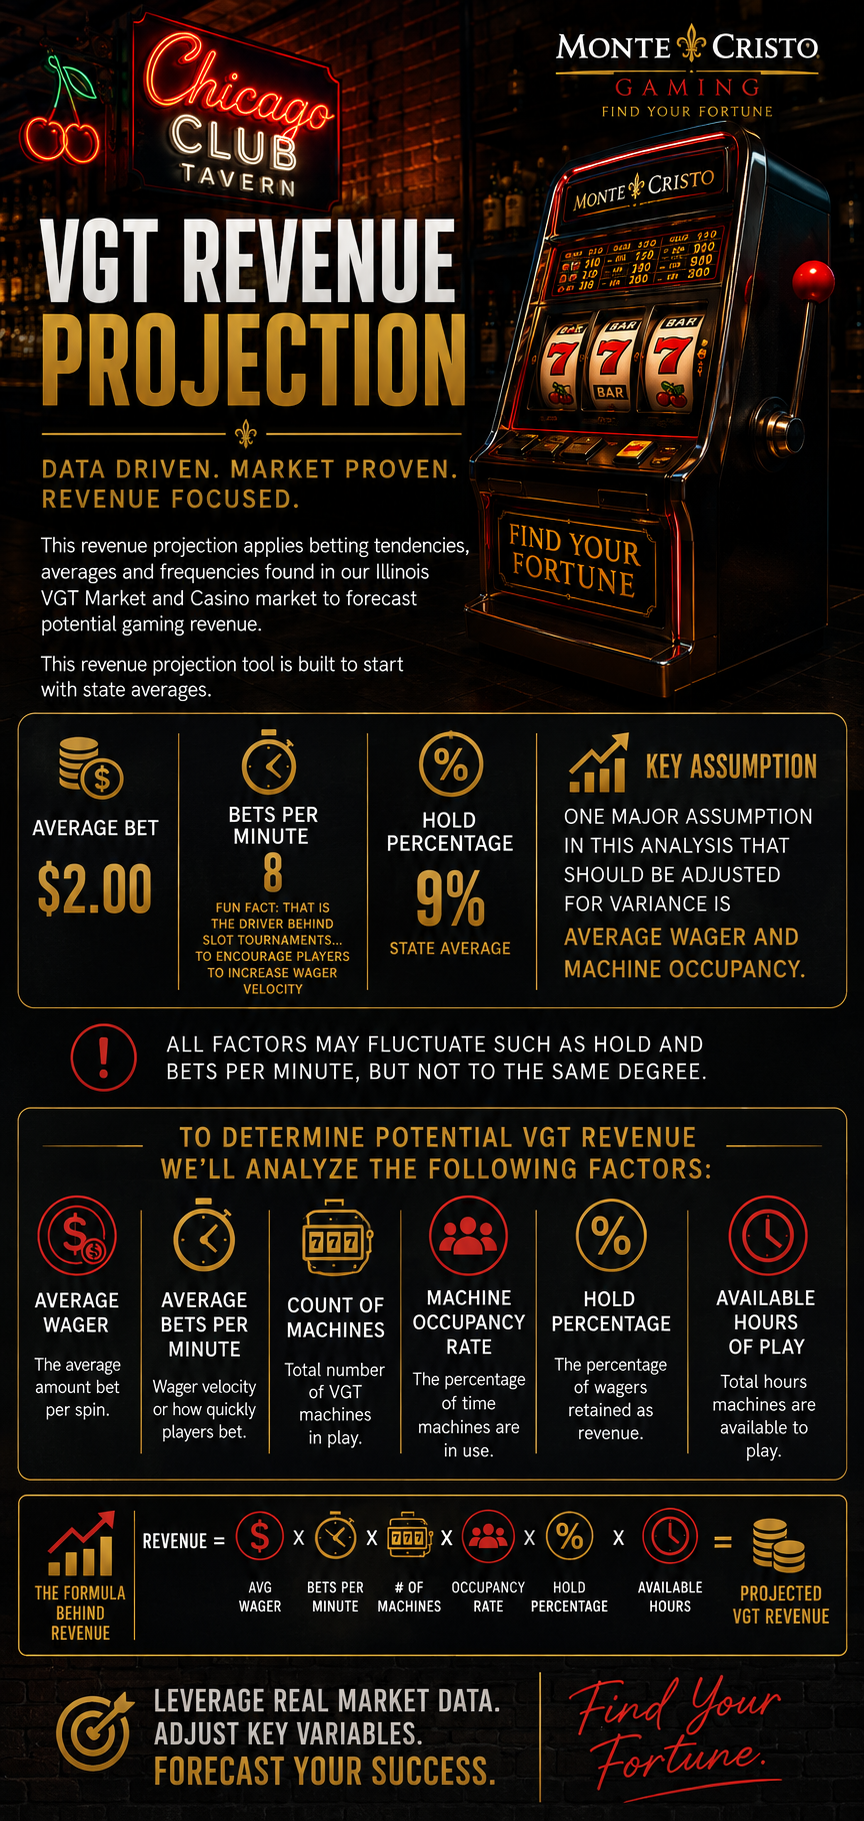
Adjust the assumptions below to model your establishment's potential. Built on real Illinois VGT market behavior — average wagers, play speed, machine occupancy, and hold.
Your Assumptions
Share of the day at least one seat is in play, by daypart. Defaults reflect a typical Illinois location. Top-performing rooms run much higher, so compare your result to the benchmarks below.
Projected Performance
Projections are illustrative estimates only and do not guarantee results. Establishment share is estimated at about 32% of Net Terminal Income: after the 35% state and municipal tax and the ~0.92% administrative fee, the remainder is split 50/50 with the terminal operator. Actual results vary by location, clientele, hours, game mix, and market conditions. Benchmark markers reflect Illinois Gaming Board monthly reporting across ~8,900 licensed establishments. Monte Cristo Gaming makes no representation or warranty regarding future performance.